Marketing Mix Model: What Drives Bottled-Water Sales
A marketing mix model on 161 weeks of FMCG data that separates the effect of weather, price, distribution and media on sales, and measures the revenue each media channel returns.

The problem
Media was under 1% of sales and ran in short, overlapping bursts, so its effect is buried under weather, pricing and distribution. Simple correlations mislead here: price looks positively related to sales, and store counts rise every summer because they follow demand.
Constraints
- Only 161 weekly observations, so every extra parameter has to earn its place.
- TV ran for 3 weeks and outdoor for 5, often alongside other channels, which limits how precisely their effects can be measured.
- No margin data, so return on investment is measured in revenue, not profit.
Key decisions
Weighted distribution (ACV) chosen over the number of stores selling
The store count rises every summer because it counts any store that sold at least one unit, so it follows demand instead of explaining it. Weighted distribution measures shelf presence, which the brand actually controls.
Price relative to competitors chosen over the brand's own average price
All brands raised prices with inflation, and the average price falls automatically when more is sold on promotion. The base price against the competitor average isolates the pricing decision.
Log-linear regression with adstock and saturation chosen over a machine-learning model
With 161 weeks a flexible model would memorise noise, and the client needs to know why sales move, not just a forecast. Each coefficient reads directly as a percentage effect.
A strict holdout that re-runs the whole pipeline chosen over in-sample fit alone
Choosing carryover rates on all the data and then testing on part of it leaks information. Re-running everything without the last 12 weeks gave an honest 4.2% forecast error.
System flow
A simplified view of how the main parts work together.
Weekly data
161 weeks of sales, price, promotion, distribution, competitor, weather and media data, checked for gaps and inconsistent definitions.
Drivers and media transforms
Price relative to competitors, weighted distribution and weather; media spend through adstock and saturation.
Log-linear regression
Ten drivers with Newey-West errors, validated on a strict 12-week holdout.
Decisions
Decomposition, ROI with ranges, response curves and a budget scenario, exported straight into the slides.
A bottled-water brand wanted to know two things: how well its advertising works, and what else drives its sales. This model answers both from 161 weeks of sales, price, promotion, distribution, competitor, weather and media data (January 2022 to January 2025).
It is a log-linear regression, so every effect reads as a percentage change in volume. Media spend passes through adstock (advertising keeps working for weeks after it airs) and a saturation curve (each extra pound does less than the one before). Carryover rates come from a grid search of 2,058 models within business-sense ranges, keeping only models where every media effect is positive.
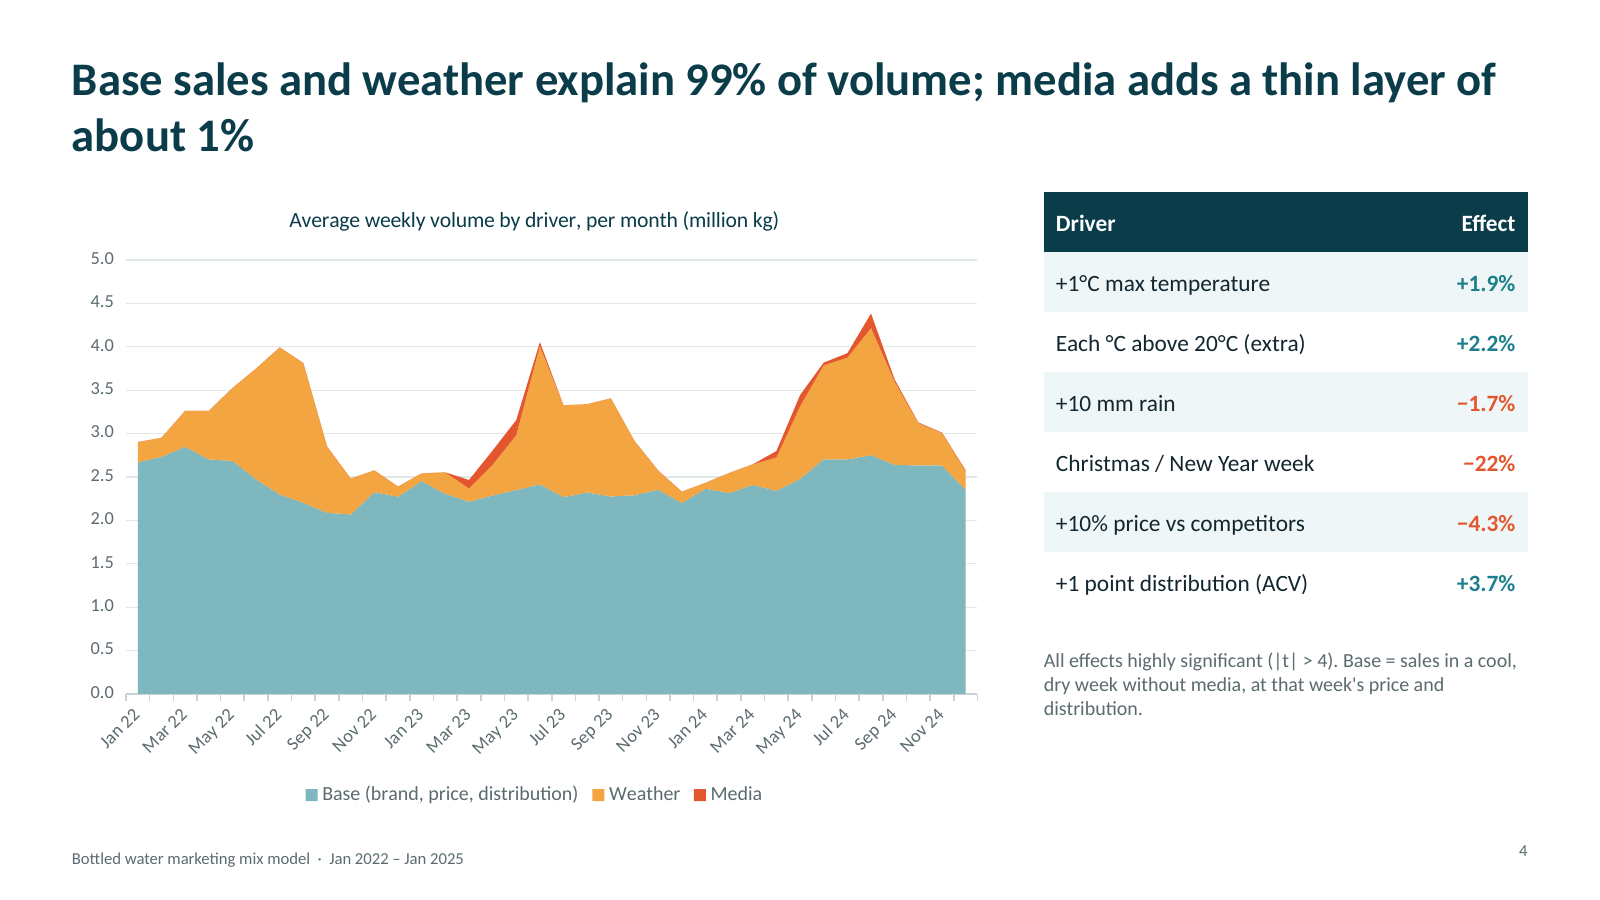
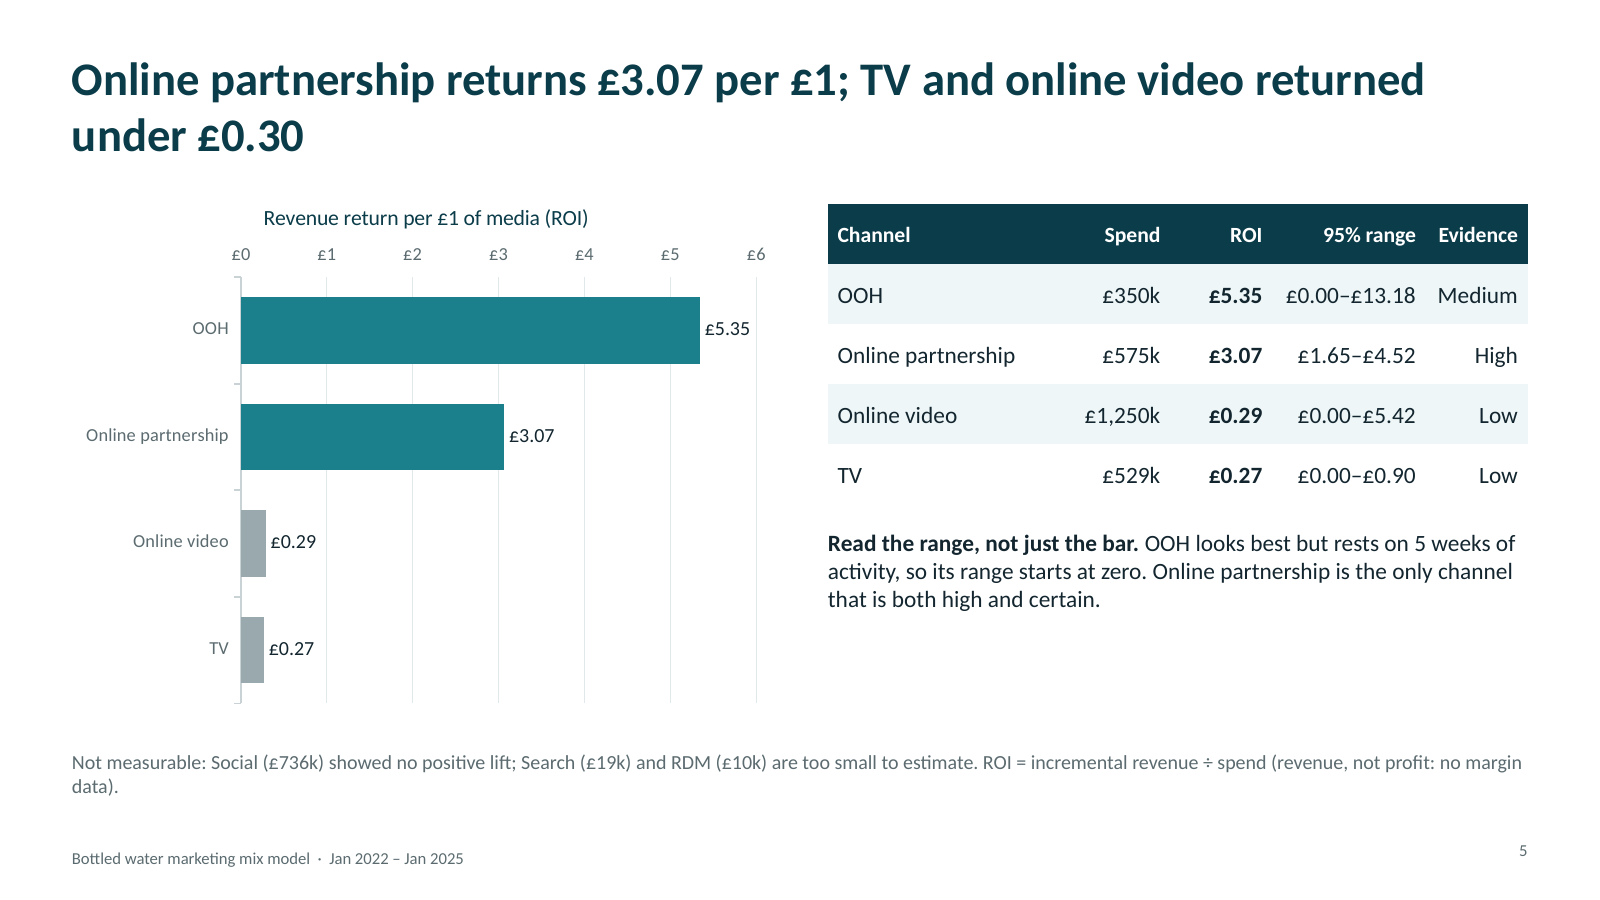
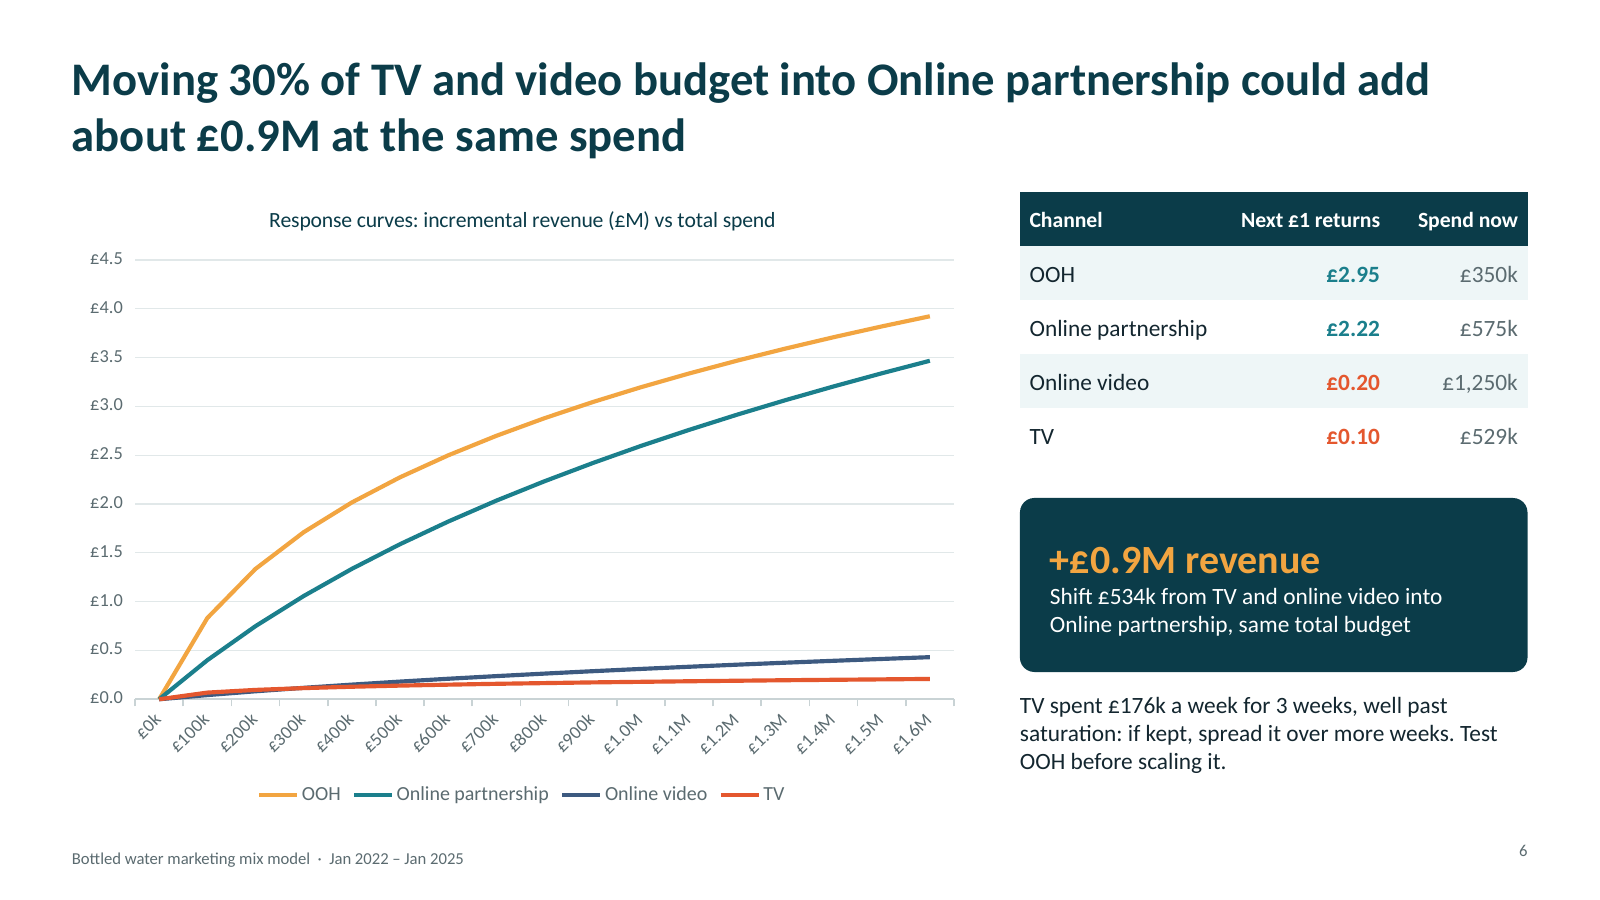
Base sales are about 79% of volume, weather about 20% and media about 1%. One point of weighted distribution adds 3.7% volume, and a price 10% higher than competitors costs 4.3%. Online partnership returned £3.07 of revenue per £1 with a tight range; TV and online video returned under £0.30. Moving 30% of the TV and video budget into Online partnership adds about £0.9M of modelled revenue at the same total spend.
The slides are generated from the model outputs rather than typed by hand, and 20 automated tests check the data, the model maths and that every number on the slides matches the model.
Outcome
- Explains 91% of weekly variation and forecasts 12 unseen weeks within 4.2%
- Online partnership returns £3.07 per £1 (range £1.65 to £4.52); TV and online video under £0.30
- Moving 30% of the TV and video budget adds about £0.9M of modelled revenue at the same spend
- One point of weighted distribution is worth 3.7% volume, about £6M a year